
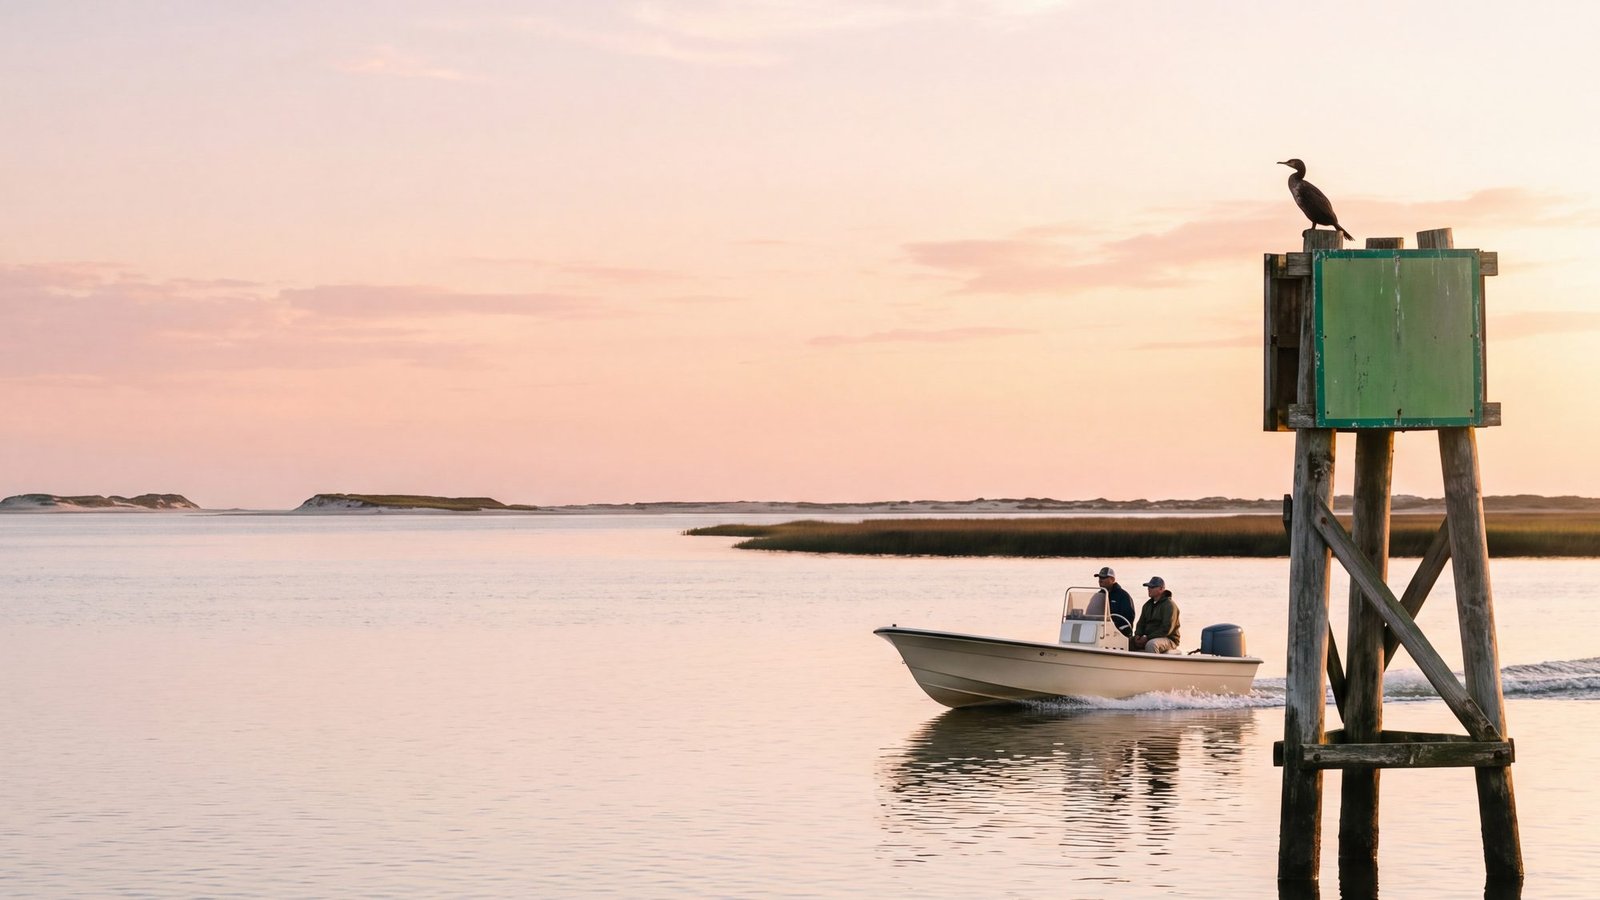
Behind the Outer Banks lies the second largest estuary system in the lower forty-eight — Currituck, Albemarle, Croatan, Roanoke and Pamlico. Thousands of square miles of open water, and hardly any of it deep.
It does not behave like the ocean four miles east of it. The tide barely works. The soundings on the chart are, in places, older than the state of Oklahoma. The channels that are maintained get surveyed on wildly different schedules, and some have not been looked at in years. None of that is on the screen in front of you.
This section is about navigating that water — what the chart knows, what it does not, and which tools tell you the difference. We make free maps of this coast and sell none of the products discussed here.
The three things that catch people out
1. The moon hardly moves this water. On the ocean beach at Duck the mean tide range is about 39 inches. At Manteo, in Shallowbag Bay, it is about 3.6 inches. Inside the sounds the wind sets the water level, not the tide table.
2. The chart is old. NOAA’s own bathymetric dataset for Pamlico Sound is built from sixty-five hydrographic surveys spanning 1874 to 1980 — ten of them from before 1900, and nothing at all newer than 1980.
3. Some of it is not on any chart. Submerged stumps, fish stakes that may be underwater, oyster rock marked as submerged rocks, and crab pots. See what is actually down there.
The moon hardly moves this water
The Outer Banks work as a wall. Ocean tide gets in through three inlets and dies almost immediately. The US Geological Survey put it plainly in its study of these estuaries: “the mean tide range in the ocean off Cape Hatteras is about 3.6 feet … while the range within Pamlico and Albemarle Sounds is less than half a foot.”
NOAA’s own published tide ranges for its stations show exactly how fast it falls away (NOAA’s datum for the Cape Hatteras pier itself is about three feet; the USGS figure is for the open ocean off the cape). These are mean ranges — average high water to average low water:
| Where | Mean tide range |
|---|---|
| Duck — ocean beach | about 39 inches |
| Cape Hatteras pier — ocean | about 36 inches |
| Oregon Inlet, in the throat | about 23 inches |
| Oregon Inlet Marina, just inside | about 11 inches |
| Ocracoke, in Pamlico Sound | about 10 inches |
| Rodanthe, sound side | about 7 inches |
| Swanquarter, western Pamlico | about 4 inches |
| Manns Harbor, Croatan Sound | about 3.7 inches |
| Manteo, Shallowbag Bay | about 3.6 inches |
Mean range of tide published by NOAA Tides & Currents for each station, read September 2026.
Ten miles inside an inlet the astronomical tide is effectively gone. In Currituck Sound there is none at all — the Coast Pilot says flatly that “there are no periodic tides in Currituck Sound; the water level depends upon the force and direction of the winds.” NOAA does not even publish tidal datums for the Currituck stations, because there is no usable tide to compute.
What moves it instead
Wind. A steady blow pushes water down the long axis of a sound and piles it up at the far end — a wind tide, sometimes called wind setup. It is the difference between the water level you get and the water level the tide table promised.
The numbers, where an official source gives them: in Croatan Sound, the Coast Pilot says wind “under exceptional conditions may lower or raise the level as much as 1.5 feet from normal; easterly winds lower the water and westerly winds raise it.” In Albemarle Sound, the Geological Survey recorded routine wind-driven swings of one to two feet, and more than four feet above mean sea level at Edenton and Elizabeth City during Hurricane Donna. On the lower Neuse, heavy gales move it about two feet, and three to four feet at New Bern.
Nobody has published a single headline figure for Pamlico Sound proper, so we are not going to invent one. The rule that matters is the one the Geological Survey states directly: “actual tide heights and currents in Pamlico Sound often differ from predictions, primarily because of the unpredictable effects of winds.”
What this means for the app in your hand. Every chart app will happily draw you a tide curve for a sound station. In four inches of range, that curve is close to meaningless — and the two feet of wind sitting on top of it, which is what will actually put you on the bottom, is not in it. Watch the forecast wind and its direction relative to the water you are crossing. Our sister site covers the mechanics: how wind and pressure move the water, live sound water levels, and Currituck Sound, where the wind is the whole story.
The chart under you is older than you think
This is the fact that reframes everything else. NOAA publishes a bathymetric model of Pamlico Sound — the digital picture of the bottom. Its own documentation records what went into it: sixty-five hydrographic surveys containing 648,402 soundings, of which “ten surveys in the southwest dated prior to 1900,” and the rest “dated from 1913 to 1980.” The stated span of the source data is 1874 to 1980.
Nothing newer than 1980. Some of it taken by men with lead lines in the 1870s, on a bottom made of sand, in a sound whose inlets have opened, closed and moved since.
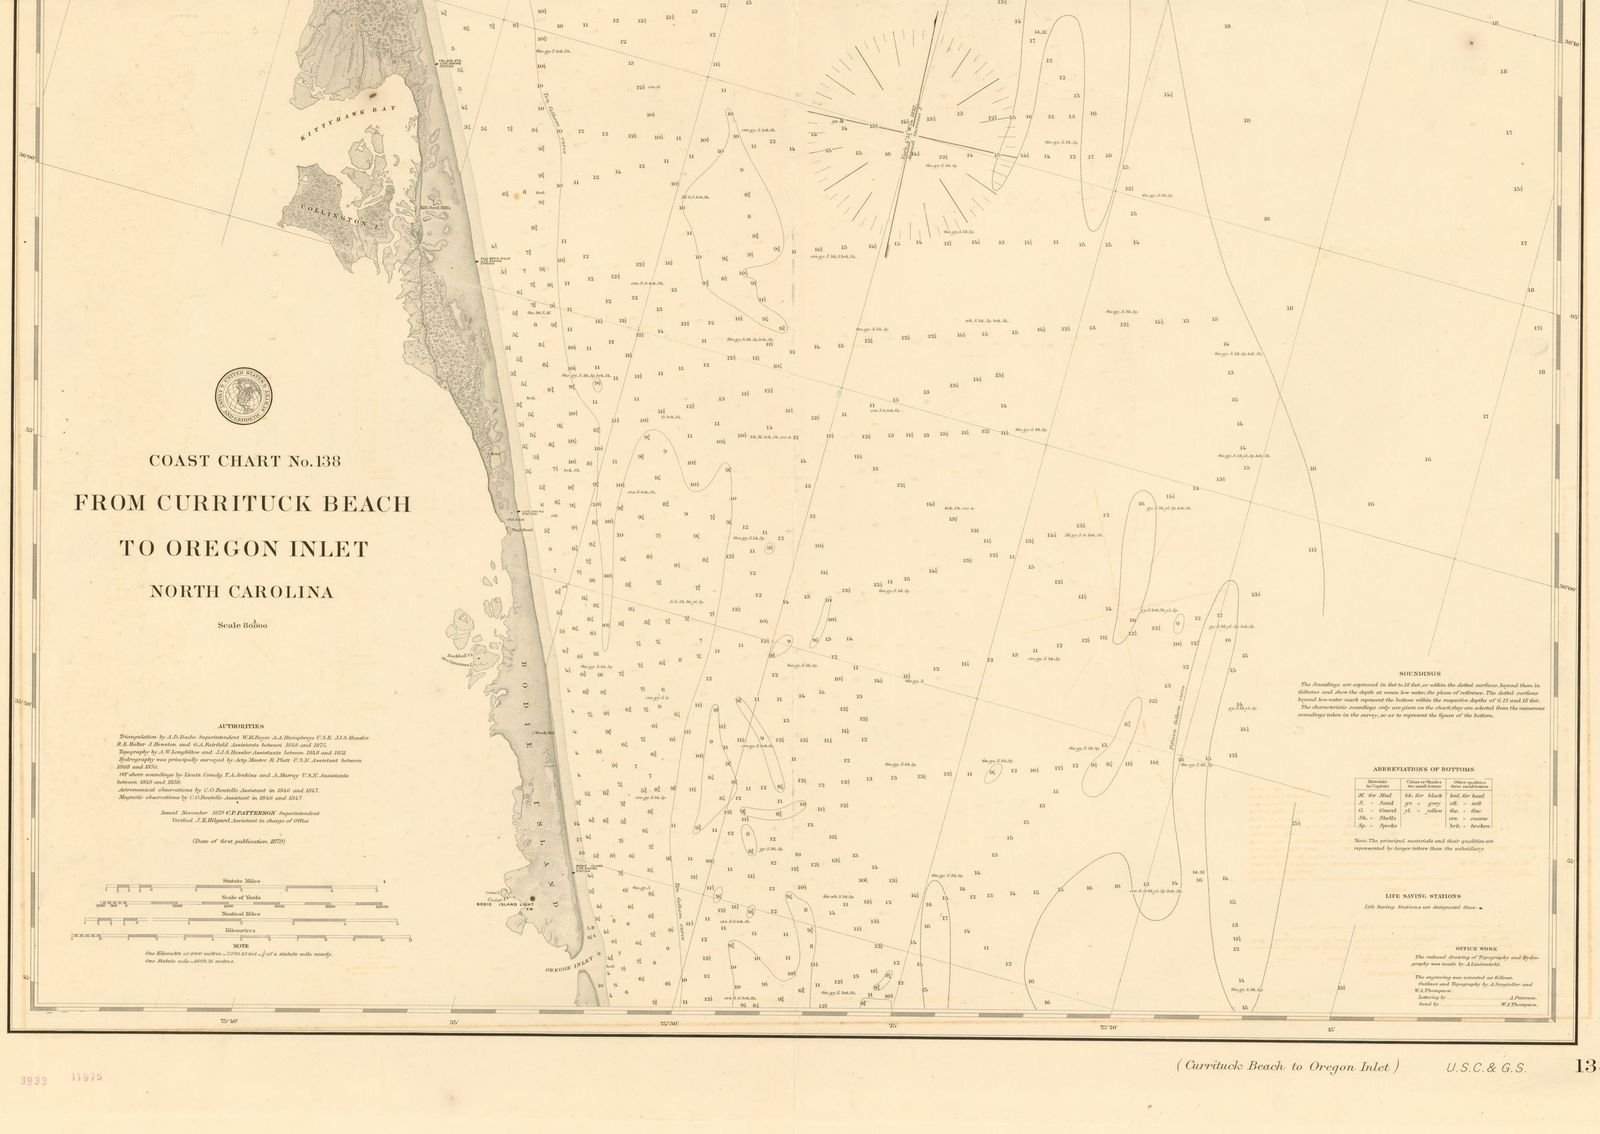
That is not a scandal — it is what hydrographic coverage looks like in a huge, shallow, low-traffic estuary, and NOAA is entirely open about it. But it does explain why two chart apps can disagree with each other and both be wrong, and why the freshest number available for a maintained channel does not come from the chart at all. It comes from the Army Corps of Engineers, which is the outfit that actually goes out and measures the channels it dredges.
Which app puts the Corps data on your screen, and which do not, is the whole of the comparison below.
How deep it actually is
- Pamlico Sound. The Geological Survey puts the average depth at about 16 feet and the maximum at about 24 feet — for a body of water covering roughly 2,060 square miles. The Coast Pilot adds the part that matters: general depths in the middle run 14 to 24 feet, “but shoals extend miles from shore in many places.” Bluff Shoal, north of Ocracoke Inlet, carries 7 to 12 feet and runs completely across the sound.
- Albemarle Sound. Maximum depth almost 30 feet, but “most of the central area of the bay is little more than 18 feet deep.” About 55 miles long and 7 miles wide on average.
- Currituck Sound. The Army Corps gives an average depth of 5 feet and a maximum of about 13 feet. The Coast Pilot: navigable in the southern part for craft drawing four or five feet, but “navigation among the extensive shoals depends on local knowledge of the channels and on the level of the water,” and the northern part is “practically unnavigable due to dense grass.”
- Croatan and Roanoke Sounds. We could not find an authoritative published average or maximum depth for either, so we are not going to print one. What is documented: both are crossed by federally maintained dredged channels, the Manteo project interior channels are authorized at 12 feet, the connecting channel north into Albemarle Sound at only 6 feet, and outside those marked channels both are shoal. The Coast Pilot on Croatan: “the dredged channel is well marked, but strangers should not attempt passage at night.”
A useful field rule, and it is sourced: submerged grass in this system grows in water roughly under six and a half feet, because that is as far down as the light reaches. If you are in grass, you are shallow.
What is actually down there
- Stumps. The Coast Pilot warns generally that vessels reporting they struck “shoals or rocks” in these rivers have often hit stumps or sunken logs. Named places: the Yeopim River entrance shoal is “foul with stumps and other obstructions and should be avoided”; the Chowan has a six-mile reach called Stumpy Reach where “the channel must be followed closely”; there are stumps on the shoals at the mouth of Kendrick Creek and along the Alligator River tributaries. On the waterway itself, the Alligator–Pungo Canal is “foul with debris, snags and submerged stumps” on both sides, with midchannel recommended.
- Fish stakes and pound nets — some of them underwater. The Coast Pilot carries a standing caution for Pamlico Sound: “Numerous fishtraps, stakes and pound nets have been reported in Pamlico Sound; some may be submerged. Small craft should use caution when operating outside the main channel.” They are noted again at the northern entrance to Croatan Sound, in Croatan itself in season, and about half a mile off the east side of the Alligator River.
- Oyster rock. North Carolina builds oyster sanctuaries out of rip-rap, crushed concrete and mined rock. They are real rock in an otherwise sandy sound. The one south of Gibbs Shoal Light is marked with white buoys carrying orange diamonds reading DANGER SUBMERGED ROCKS. State sanctuaries are marked with white buoys or pilings at the corners; artificial reefs get yellow ones.
- Crab pots. Under state rule it is unlawful to set pots “in any navigation channel marked by State or Federal agencies” or in a marked Ferry Division turning basin, and the line from pot to buoy must be non-floating. In the Northern Region — everything from Bogue Inlet north, so all of these sounds — every pot must be out of internal waters from January 1 through January 31, which is when the state runs its derelict-gear cleanup. More than 4,300 lost or abandoned pots have been pulled out of state waters in those cleanups; a sunken pot that has lost its float is a hazard nobody can see.
Where the fresh surveys are — and where they are not
The Army Corps of Engineers Wilmington District surveys the channels it maintains and publishes the results free, as PDFs, Google Earth files and raw soundings, on its hydrographic survey pages. It is the most recent picture of the bottom anyone has.
But the coverage is uneven, and knowing which is which is worth more than any app. Reading its index in early September 2026:
- Current, surveyed within months: Oregon Inlet East Spit and Bar (August 2026), Hatteras Connector Channel and Sloop Channel North (June 2026), Rollinson Channel (spring 2026), Manteo Shallowbag Bay Ranges 14, 15 and 17 and Wanchese Harbor (April–May 2026), Big Foot Slough, Silver Lake at Ocracoke and Teaches Hole (February–March 2026).
- Getting on for a year or more: Ocracoke Inlet and Rodanthe Harbor (late 2025), Stumpy Point (July 2025), several of the lower-numbered Manteo ranges (late 2024 into 2025).
- Genuinely stale: Avon Harbor and Wainwright Slough were last surveyed in 2023. Croatan Sound Ranges 1 and 2 have not been surveyed since early 2020 — that is a main north–south route between Albemarle and Pamlico. Swanquarter was last done in 2016.
The Corps is careful to say these are condition surveys, not charts: the soundings “only indicate the general condition of the channel on the date of the survey, and are not intended to be used for navigational purposes.” Fair enough. They are still the freshest measurement of that bottom in existence, and on a shifting sand bottom the date on the survey is as important as the number.
The comparisons
Chart apps
Navionics vs Aqua Map vs C-MAP
One of the three draws the government’s chart and lays the Army Corps survey soundings on top of it. The other two do not, at any price. What each costs, which is right for skinny water, and why none of them shows the buoys on the bar at Oregon Inlet.
Read the comparison →
Next up
Reading an Army Corps survey
How to pull the Manteo, Rollinson or Big Foot Slough survey, what the colors and the spot soundings mean, and how to tell a shoal that is real from one that moved three dredgings ago.
Next up
Wind tide, in practice
Which wind direction empties which sound, how long it takes, and how to read a forecast as a water-level forecast instead of a tide table that does not apply.
How we do this
- Where the data comes from, first. Before features, before price: is this the official government chart, a publisher’s redraw of it, crowd-sourced, or somebody’s scrape? That answer predicts almost everything else.
- How fast an update reaches your screen. A chart is a pipeline, not a picture. We follow the pipeline — who surveys, who publishes, who compiles, how long each hop takes.
- Prices with a date on them. App pricing moves. Every figure says when it was read and links to the live listing.
- What the tool cannot do. Usually the most useful section. Some of what people want here is not available at any price, from anyone.
- We say when we have not tested something. Reading documentation is not the same as running an app on a boat, and we will not blur the two.
- No affiliate links, no paid placement, no app of our own to sell you. Most app comparisons on the internet are published by companies that sell a competing app and rank it first.
And the rule underneath all of it: out here the chart is a record of what somebody measured, not a description of what is there now. In Pamlico Sound, some of what they measured, they measured in the 1870s. The good tools are the ones that make it easy to see how old their information is.
Asked and answered
How deep is Pamlico Sound?
Shallower than most people expect for a body of water that size. The US Geological Survey puts the average depth at about 16 feet and the maximum at about 24 feet across roughly 2,060 square miles. NOAA’s Coast Pilot gives general depths in the middle of 14 to 24 feet, but notes that shoals extend miles from shore in many places. Bluff Shoal, north of Ocracoke Inlet, carries 7 to 12 feet and runs completely across the sound.
Does Pamlico Sound have tides?
Barely. The Outer Banks block the ocean tide almost completely. The US Geological Survey puts the mean tide range in the ocean off Cape Hatteras at about 3.6 feet, while the range inside Pamlico and Albemarle Sounds is less than half a foot. At Manteo, in Shallowbag Bay, NOAA’s published mean range is about 3.6 inches. Wind, not the moon, sets the water level in the sounds.
What is a wind tide?
A change in water level caused by wind rather than by the moon. A steady blow pushes water down the long axis of a shallow sound and piles it up at the far end, so one shore loses water while the other gains it. In Croatan Sound the Coast Pilot says wind can raise or lower the level by as much as 1.5 feet under exceptional conditions, and the Geological Survey recorded routine swings of one to two feet in Albemarle Sound. That is several times the astronomical tide range here.
Does Currituck Sound have a tide?
No. NOAA’s Coast Pilot states there are no periodic tides in Currituck Sound and that the water level depends upon the force and direction of the winds. NOAA does not publish tidal datums for the Currituck stations, because there is no usable tide to compute.
Why are the nautical charts of Pamlico Sound so old?
Because the surveys behind them are. NOAA’s own documentation for its Pamlico Sound bathymetric model lists 65 hydrographic surveys containing 648,402 soundings, ten of them dated before 1900 and the rest from 1913 to 1980. The stated span of the source data is 1874 to 1980, with nothing newer. That is normal for a huge, shallow, low-traffic estuary, but it explains why the freshest depth figures come from somewhere else.
Where can I find current depths for a dredged channel here?
The US Army Corps of Engineers Wilmington District publishes its condition surveys free as PDFs, Google Earth files and raw soundings. Coverage is uneven: several Outer Banks channels were surveyed in 2026, while Croatan Sound has not been surveyed since early 2020 and Swanquarter not since 2016. Always check the date on the survey, and note the Corps states these are not intended for navigation.
When do crab pots have to be out of the water in the North Carolina sounds?
In the Northern Region, which covers everything from Bogue Inlet north and so all of these sounds, state rule requires every pot to be out of internal waters from January 1 through January 31. It is also unlawful to set pots in any marked navigation channel or in a marked Ferry Division turning basin, and the line from pot to buoy must be non-floating. Rules change, so check the current text before setting gear.
Checked against the sources
Tide ranges are the mean range of tide published by NOAA Tides & Currents for each named station, read September 2026. The ocean-versus-sound comparison and the Albemarle wind figures are from the US Geological Survey’s Hydrology of Major Estuaries and Sounds of North Carolina. The Currituck, Croatan, Neuse and channel quotations are from NOAA’s United States Coast Pilot 4, Chapters 4 and 12, 2025 edition as updated August 30, 2026.
The age of the chart data is from NOAA’s own published metadata for its Pamlico Sound bathymetric model, which lists its source surveys and their dates. Depths are from the Geological Survey (Pamlico, Albemarle), the Army Corps of Engineers (Currituck) and the Coast Pilot. Where no authoritative depth exists — Croatan and Roanoke Sounds — we say so instead of estimating.
Hazards are quoted from Coast Pilot 4 and from the North Carolina Division of Marine Fisheries. The crab pot rules are from the North Carolina Administrative Code, 15A NCAC 03J .0301 and 03R .0118; rules change, so check the current text before you set gear. Survey dates were read off the Army Corps Wilmington District survey index in early September 2026 and move as new surveys are posted.
What we sell: nothing on these pages. No affiliate links, no paid placement. This is general information about a body of water, not navigational advice — carry the official chart and use your own judgement. Last checked: September 2026.