
Three apps come up over and over when somebody asks what to run on the phone or the tablet out here: Navionics Boating, which Garmin owns; Aqua Map, made by a small Italian outfit called GEC; and the C-MAP App, from Navico — the company behind Lowrance, Simrad and B&G. Most of the comparisons you will find online are written by companies that sell a fourth app, and they compare feature lists.
Feature lists are not the problem on this coast. The problem is the water. Almost everything you will run behind these islands is shallow — Currituck averages about five feet, Pamlico is mostly under twenty and shoals reach miles out from shore — and it moves. Oregon Inlet is dredged continuously and the channel was picked up and put somewhere else in 2022. Hatteras Inlet went from a quarter-mile wide to more than two miles wide in a generation. So the question worth answering is not which app has more buttons. It is which one shows you the freshest picture of the bottom, and where all three of them stop being able to help you at all.
We make maps of this coast. We do not sell any of these apps, we are not paid by any of these companies, and there are no affiliate links on this page. What follows is what the three products actually are, what they cost as of September 2026, and the one thing about the inlets that none of them can fix.
The short answer
For the sounds, the inlets and the ICW through Albemarle — Aqua Map, with the Master add-on. It draws the official NOAA chart and then lays the Army Corps of Engineers’ own survey soundings on top of it. Neither of the other two offers that at any price, and the Corps is the outfit that actually measures this bottom.
If there is a Garmin chartplotter at the helm — Navionics. Of the three, it is the only app that moves routes and markers to a plotter and handles the chart card’s subscription. That plumbing is worth more than a cartography argument.
If you want to plan for free, or you run Lowrance, Simrad or B&G — C-MAP. It has by far the most generous free tier of the three and the cheapest paid one. Read the free-tier catch below before you rely on it.
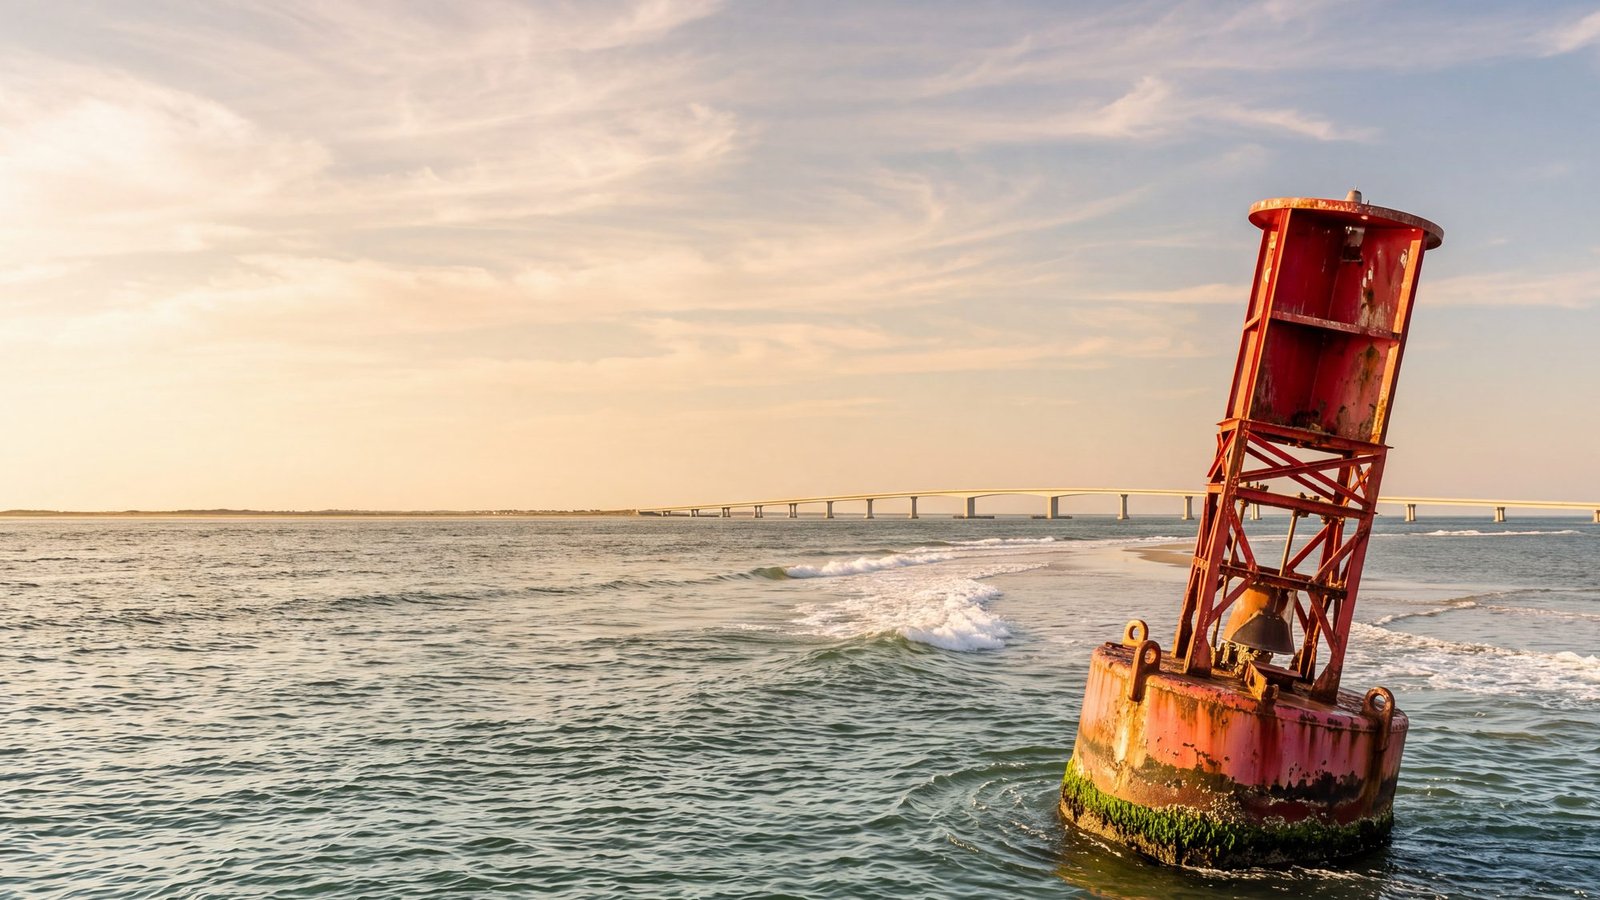
None of the three will show you the buoys on the bar at Oregon Inlet or Hatteras Inlet. That is not a knock on the apps. Those buoys are deliberately left off the chart. The reason is worth four minutes of your life.
They are not the same kind of product
This is the part every feature table skips. The three apps get their charts from different places, and that difference is most of the comparison.
Aqua Map draws the government’s chart
Aqua Map renders NOAA’s official Electronic Navigational Charts — the ENC — plus the Canadian service’s charts to the north and Army Corps survey data. What you are looking at is the government product, drawn by an app. When NOAA changes the chart, the change reaches you on NOAA’s schedule, and NOAA releases ENC update files every weekday evening.
Navionics and C-MAP draw their own
Both build proprietary cartography compiled from hydrographic-office source data plus their own surveys and, in both cases, sonar logs uploaded by users. C-MAP is explicit that no hydrographic office has verified its product. These are published charts on a publisher’s release schedule, which by definition sit a step behind the raw government file. In exchange you get things the raw chart does not have: shaded relief, community depth layers, auto routing, satellite overlays.
One thing worth noting because it is hard to find out: Aqua Map’s update pipeline is public and C-MAP’s is not. NOAA says when it publishes; Aqua Map says how often it pulls. We could find no published statement from C-MAP about how often the app’s charts are refreshed. That is not proof they are stale — it means you cannot check.
Neither approach is wrong. They are aimed at different boats. A chart redrawn for readability is easier to look at in a seaway; a chart that is the government file is easier to trust when you are working out whether a shoal is real.
What they cost
Prices below were read off the US App Store listings on September 2, 2026. App pricing changes without much warning — the links go to the live listings, and the year is on the table for a reason.
| Aqua Map | Navionics Boating | C-MAP | |
|---|---|---|---|
| The app | Free | Free | Free |
| Charts for here | $14.99 a year or $49.99 once, forever | $49.99 a year | Premium $14.99 a year |
| One-time option | Yes | No | Older regional map packs still listed; the current product is the subscription |
| Usable free tier | 14-day trial | 14-day trial | Yes — charts, routing, waypoints, GPX, weather. No GPS position, no offline |
| Army Corps survey overlay | Yes — Master add-on, $24.99 a year | No | No |
| Community depth layer | No | SonarChart | Genesis Social Map, free; Edge tier extra |
| AIS | Over WiFi from your own instruments | Over WiFi from your own instruments | Built in with Premium — Class A and B within about 60 miles |
| App syncs to a chartplotter | No | Yes — Garmin | No — that is the separate Lowrance / Simrad / B&G apps |
| Phones and tablets | iPhone, iPad, Android | iPhone, iPad, Android | iPhone, iPad, Android |
Read from the Aqua Map, Navionics Boating and C-MAP US App Store listings and C-MAP’s own feature table, September 2, 2026.
The practical version. The setup we would actually run out here — Aqua Map’s forever charts plus the Master add-on — costs about seventy-five dollars the first year and twenty-five a year after that. C-MAP Premium is fifteen a year. Navionics is fifty a year, every year, and stays fifty whether you use it in January or not. Over five seasons that spread is real money, and it is the clearest single thing separating the three.
The free-tier catch. C-MAP’s free version is unusually generous — full chart viewing, manual and automatic routing, waypoints, tracks, GPX in and out, weather. What it does not include is your own position on the chart, or offline maps. So it is an excellent planning tool on the couch and not a navigation tool on the boat. That distinction is worth understanding before you leave the dock on a free account and a marginal signal.
One nuance worth knowing before you argue with anybody about it: Navionics sells access, not charts. Every region on its store listing is an annual subscription. Aqua Map sells both — the same charts by the year, or bought once and kept. Boaters reported the Navionics app going from about twenty-five dollars a year to fifty in late 2023, and the announcement post those threads pointed at is no longer online, so treat the history as reported rather than documented. The current number is not in dispute.
The tide button does not work in the sounds
All three apps will happily draw you a tide curve for a sound station. Behind these islands that curve is close to meaningless, and it is worth understanding why before you plan a shallow crossing around it.
The Outer Banks work as a wall. Ocean tide gets in through three inlets and dies almost immediately. NOAA’s own published mean tide range on the ocean beach at Duck is about 39 inches. At Manteo, in Shallowbag Bay, it is about 3.6 inches. At Manns Harbor in Croatan Sound, about 3.7. In Currituck Sound there is no periodic tide at all — the Coast Pilot says the water level there “depends upon the force and direction of the winds,” and NOAA does not publish tidal datums for those stations because there is no usable tide to compute.
What moves the water instead is wind, and it moves it by far more than the tide does. In Croatan Sound the Coast Pilot says wind “under exceptional conditions may lower or raise the level as much as 1.5 feet from normal.” In Albemarle Sound the US Geological Survey recorded routine wind-driven swings of one to two feet. So in a sound with four inches of tide range, the foot or more that actually decides whether you clear a shoal is not in the tide curve at all.
None of the three apps models this, and none of them claims to. It is not a mark against any of them — it is a reason not to steer by that number. Inside the sounds, read the observed water level and the wind forecast rather than the prediction: our sister site keeps live sound water levels and an explainer on how wind and pressure move it. The fuller version is in our shallow water navigation guide.
The Army Corps overlay, and why it matters here
This is the feature that decides the comparison on the Outer Banks, and almost nobody explains it. To see why it matters, start with how old the chart under you actually is.
NOAA publishes a bathymetric model of Pamlico Sound — the digital picture of the bottom — and documents what went into it: sixty-five hydrographic surveys containing 648,402 soundings, ten of them dated before 1900 and the rest “from 1913 to 1980.” The stated span of the source data is 1874 to 1980. Nothing newer than 1980, on a sand bottom, in a sound whose inlets have opened, closed and moved since.
That is not a scandal — it is what hydrographic coverage looks like in a huge, shallow, low-traffic estuary, and NOAA is open about it. But it is why the freshest number available for a maintained channel does not come from the chart at all.
The US Army Corps of Engineers surveys the channels it maintains — running a survey boat back and forth across a range and recording the depth — and files the result in a national database. Those surveys are far more recent, and far denser, than the soundings printed on a nautical chart, because a chart sounding may be decades old while a Corps survey of a dredged channel may be weeks old.
Aqua Map’s Master add-on puts those surveys on the chart. Depth areas are shaded from dark red for the dangerous end, roughly under three feet, through to blue for water over fifteen, with spot soundings on top, and the depths are referenced to the same datum the chart uses, so you can compare them directly without doing arithmetic. Aqua Map says the set is refreshed weekly — though it also notes that some Corps districts upload promptly and others run weeks behind, so weekly is the app’s cadence, not a promise about how old any one survey is. Its own pages give the count as more than eighty thousand surveys in one place and more than ninety thousand in another.
Neither Navionics nor C-MAP offers this at any price. What they have instead is crowd-sourced sonar — Navionics’ SonarChart and C-MAP’s Genesis — contours built from logs uploaded by users. C-MAP’s version runs the uploads past a quality-control team before publishing, which is a real advantage over unfiltered community data. But both are the same shape of thing, and that shape has a known weakness here.
On a bass lake, crowd-sourced sonar is fantastic, because people run transects all over it. C-MAP says as much itself: Genesis charts “have revolutionized freshwater fishing,” and it points specifically at small inland lakes government agencies never surveyed. On a shifting ocean bar it is thin, because nobody is out there running survey lines across the breakers for fun, and everyone who does cross it stays in the same narrow line they already trust. Crowd data tells you where boats went. It does not tell you where the shoal is.
What the Corps has actually surveyed near you
The Wilmington District publishes its Outer Banks surveys as PDFs, Google Earth files and raw soundings, free, on one page. As of early September 2026 that page listed Oregon Inlet East Spit & Bar surveyed on August 10, 2026 and the Manteo range through Wanchese Harbor surveyed in May.
Inside the sounds the coverage is far more uneven, and this is the part that should decide how much you trust the layer: Rollinson Channel, the Hatteras Connector, Big Foot Slough, Silver Lake at Ocracoke and the main Manteo ranges were all surveyed in 2026, but Avon Harbor and Wainwright Slough were last done in 2023, Croatan Sound Ranges 1 and 2 have not been surveyed since early 2020 — on a main north–south route between Albemarle and Pamlico — and Swanquarter was last surveyed in 2016. That is exactly what a survey-age filter is for, and exactly why “the Corps data is on my chart” is not the same as “the Corps data is current everywhere on my chart.”
You can read those PDFs yourself for free without buying anything. What the Master add-on buys you is not the data. It is not having to open a PDF on a boat.
The part that decides it at Oregon Inlet — and it is not the app
In September 2022 somebody posted a thread on The Hull Truth titled, plainly, “Oregon Inlet buoys on Navionics and C-Map.” The question was why both apps showed the buoys in the wrong place when the Coast Guard publishes updates every week. “The difference between the current buoy locations and what they show,” the poster wrote, “is astonishing.” The thread is still there, and people were still adding to it years later.
The apps are not the problem. Here is what the United States Coast Pilot — NOAA’s own companion volume to the chart — says about Oregon Inlet:
“Oregon Inlet … is entered over a shifting bar. A lighted whistle buoy marks the approach; other buoys, not charted, are frequently shifted in position to mark the best water. … The inlet, used by local fishing vessels but not recommended to strangers, requires continuous dredging; it deepens with northwest winds and fills in with northeast winds.”
— Coast Pilot 4, Chapter 4, 2025 edition, chapter updated August 30, 2026
And Hatteras Inlet, eleven miles west of the light: “entered over a shifting bar that is subject to continual change; local knowledge is recommended … buoys marking the channel over the bar are not charted because they are frequently shifted in position.”
Not charted. The buoys on the bar are moved so often that NOAA does not put them on the chart at all, on purpose. So no app — not Navionics, not Aqua Map, not C-MAP, not the free ones, not the expensive ones — can show you where they are, because there is no authoritative position to show. The Coast Guard moves the cans to follow the water and the chart never claims to know where they went.
This is not theoretical here. In June 2022, three months before that forum thread, the Coast Guard gave up on the Oregon Inlet channel that ran along the east side of Bodie Island, declaring it no longer possible to safely mark or maintain, and established a new channel to the northeast off Pea Island instead. A Corps survey that May had found four feet of water in a spot boats were using. The channel did not shift — it was picked up and put somewhere else.
The best answer anybody gave in that thread came from a local, and it is the whole page in one line:
“Best not to ever go by any charts in Oregon inlet other than the corps survey charts or local knowledge.”
— a reply on that 2022 Hull Truth thread
That is the honest ranking. On the bar, none of the three, and anyone who tells you otherwise is selling something. Inside the inlet and up into the sounds, where there are charted ranges and Corps surveys, Aqua Map with Master is the better picture — and note that it is the only one of the three that puts the Corps surveys the local recommended directly on your screen. Across the bar, you run the markers you can see, on a fair tide, behind somebody who does it every day, and the screen is there to tell you where you are, not where the channel is.
If that is the trip you are planning, our sister site has the tide and current side of it: running Oregon Inlet, how the two inlets differ, and why the bottom under an inlet behaves the way it does.
Where each one is genuinely better
Aqua Map is better at
- Being the government’s chart. No compilation lag, no editorial redraw. When NOAA updates the ENC, that is your chart.
- Army Corps surveys on the chart. The single most useful thing you can put on a screen in shoal water, and the other two do not offer it at any price.
- Not renting your charts forever. The one-time purchase is a real option and it costs the same as one year of Navionics.
- How its users rate it. On the iPhone listing Aqua Map sits around 4.7 stars from roughly thirteen thousand ratings — the best of the three. Caveat: its Android build rates noticeably worse than its iPhone one, so this is an iPad-and-iPhone advantage more than a blanket one.
Navionics is better at
- Talking to a chartplotter. Alone among the three, the app itself moves routes and markers to a plotter and manages the chart card’s subscription — if that plotter is a Garmin. C-MAP’s plotter syncing lives in the separate Lowrance, Simrad and B&G apps, not in the C-MAP app.
- Dock-to-dock routing. Auto Guidance draws a route around the shallow water for your draft. Treat it as a suggestion, not a plan — but it is the most polished of the three.
- Sheer number of users. Five million-plus installs on Android alone, against about a million for C-MAP and a hundred thousand-plus for Aqua Map. More users means more community sonar, more people who can help when it misbehaves, and more chance the guy at the ramp is running the same screen.
C-MAP is better at
- Costing nothing to plan with. The free tier is the most generous of the three by a distance — charts, manual and auto routing, waypoints, tracks, GPX import and export, weather. Just remember it will not show you where you are.
- Price, once you do pay. Premium is the cheapest full tier here, and it is the only one of the three that includes AIS without you supplying your own receiver — Class A and B inside about 60 miles.
- Quality-controlled crowd data. Genesis Social Map is free, and C-MAP puts uploads past a review team before publishing them. That is a better process than raw community data, even if the coverage out here is thin.
- Being the right ecosystem if the electronics on your boat are Lowrance, Simrad or B&G — the charts, the Genesis contours you record yourself, and the plotter all come from the same house.
Which one you should actually buy
- Skiff fishing the sounds — Roanoke, Croatan, Pamlico, Currituck. Aqua Map plus Master. The Corps surveys the Manteo ranges and Wanchese approach several times a year and you will be looking at them.
- Running the inlet to fish offshore. Aqua Map plus Master, for the most recent survey of the East Spit on the screen behind you — and read the buoys section above before you decide the app matters at all.
- Coming through on the ICW, down the Alligator River and across Albemarle. Aqua Map plus Master, and import a set of community track files — all three read GPX. Corps survey coverage is the whole reason cruisers pick this app for this stretch.
- There is a Garmin plotter at the helm. Navionics. The ecosystem is the feature.
- There is a Lowrance, Simrad or B&G at the helm. C-MAP, and record your own Genesis contours while you fish. Just know the plotter syncing happens in your plotter brand’s own app, not in the C-MAP one.
- You fish here in summer and a lake back home the rest of the year. Navionics or C-MAP. Crowd-sourced freshwater contours are where both of those products are strongest.
- You are planning a trip from the kitchen table and do not want to spend anything. C-MAP free. Then buy something before you leave the dock.
- You mostly run skinny water and want one thing that helps. Aqua Map with Master, and check the survey date on whatever channel you are about to run before you trust the colors.
- Kayak, small skiff, occasional user, want it cheap and offline. Aqua Map’s one-time charts, or C-MAP Premium at fifteen a year. Skip the Master add-on until you are running a channel that needs it.
Try them free first
All three will let you find out on your own boat before you pay, which is the right way to settle an argument like this one.
The free trials, checked
Navionics Boating — seven-day free trial of the charts and SonarChart, started inside the app. Garmin’s own support page states the length.
Aqua Map — fourteen-day trial, “cancel anytime at no cost” in their words. Long enough to run Oregon Inlet with the Army Corps survey on screen and decide whether that overlay is worth it to you. It is.
C-MAP — no trial needed: the free tier has the charts and the routing. It just will not show your position until you pay.
Trial lengths checked September 2026 on each company’s own site; they change, so read the screen before you tap. A trial converts to a paid plan when it ends unless you cancel, so set a reminder for the day before.
What none of them do
- Show you the bar buoys. Covered above. They are not on the chart by design.
- Claim to be a navigation system. Read the fine print and the vendors say so themselves. C-MAP’s own terms are the bluntest: “THIS PRODUCT IS NOT TO BE USED FOR NAVIGATION,” and its autorouting is “for general planning only” and “should never be used as the only reference source.” None of the three meets commercial chart-carriage requirements.
- Replace a chartplotter for reliability. A phone overheats in a windshield mount, drops in the bilge and dies on a cold morning.
- Come from NOAA. There is no official NOAA chart app, on either store, despite a 2013 press release that still floats around search results about an Android beta that never shipped. NOAA gives you the chart data and web tools; the apps are all somebody else’s.
- Get you a paper chart. NOAA finished cancelling traditional paper and raster charts in December 2024 — the last of 1,007 of them. The free NOAA Custom Chart tool will build you a printable PDF of any area you pick, but it carries no chart number and no Notice to Mariners corrections.
What we have not done
We have not run these three apps side by side on the same boat over the same water and compared what each drew. Everything above comes from the vendors’ own listings, documentation and legal terms, NOAA’s publications, and the Army Corps’ survey index — all linked, all checkable, all read in September 2026.
That is a real limit and we would rather say it than pretend otherwise. When we do run them together, through Oregon Inlet and up the Manteo ranges on the same day, this page will say so and show the tracks. If you run any of them and see something here that does not match your screen, we want to hear it.
Asked and answered
Which chart app is best for the Outer Banks?
For the sounds, the inlets and the ICW, Aqua Map with the Master add-on, because it puts US Army Corps of Engineers survey soundings directly on the official NOAA chart and neither Navionics nor C-MAP offers that at any price. If there is a Garmin chartplotter at the helm, Navionics, because it is the only one of the three whose app syncs routes and markers to a plotter. If you want to plan for free, or you run Lowrance, Simrad or B&G, C-MAP.
Navionics or C-MAP — which is better?
They are the same kind of product: proprietary cartography compiled from hydrographic-office data, plus crowd-sourced sonar contours. C-MAP is cheaper, has a far more generous free tier and includes AIS; Navionics has a much larger user base, more polished dock-to-dock routing, and is the only one of the two whose app syncs to a chartplotter, which matters if that plotter is a Garmin. If your electronics are Lowrance, Simrad or B&G, C-MAP is the matching ecosystem. Neither carries Army Corps survey data.
Do Navionics, Aqua Map or C-MAP show the buoys at Oregon Inlet?
No, and neither does any other app. NOAA’s Coast Pilot states that the buoys marking the best water at Oregon Inlet are not charted, because they are shifted in position too often, and says the same of the buoys on the bar at Hatteras Inlet. There is no authoritative charted position for an app to display. Run the markers you can see.
Is the C-MAP app free?
The app is free and its free tier is unusually complete: chart viewing, manual and automatic routing, waypoints, tracks, GPX import and export and weather. But it does not include your own GPS position on the chart or offline chart download, which are Premium features. That makes the free version a planning tool rather than a navigation tool.
What are USACE surveys and do I need them on my chart?
The US Army Corps of Engineers surveys the channels it dredges and publishes the soundings. Those readings are far more recent than the soundings printed on a nautical chart. If you run dredged channels, inlets or the ICW, they are the most useful layer you can add. Aqua Map’s Master subscription draws them on the chart; you can also read the Corps’ survey PDFs free on its own website.
Is there a free official NOAA nautical chart app?
No. NOAA publishes the chart data and free web tools, but there is no NOAA-published chart app on the App Store or Google Play. A 2013 press release about an Android tablet beta still circulates in search results; that app never shipped a finished version and is not available.
Can I still buy a paper chart of the Outer Banks?
Not a traditional NOAA one. NOAA completed the cancellation of its paper and raster charts in December 2024, the last of 1,007 charts. NOAA’s free Custom Chart web tool will generate a printable, geo-referenced PDF of any area you choose, but it has no chart number and does not carry Notice to Mariners corrections.
Does a phone app subscription cover my chartplotter’s charts?
No. With Navionics, the phone app subscription and the plotter’s chart card are separate purchases; the app can activate, update or renew the card’s subscription, but paying for one does not give you the other. C-MAP chart cards for Lowrance, Simrad and B&G units are separate hardware purchases as well.
Checked against the sources
Prices, tiers, platforms and ratings: read off the US App Store and Google Play listings for all three apps, and C-MAP’s own free-versus-Premium feature table, on September 2, 2026. App pricing changes without notice — the links go to the live listings, and any figure here is only as good as that date.
The inlets: quoted from NOAA’s United States Coast Pilot 4, 2025 edition, Chapter 4, as updated August 30, 2026. The 2022 Oregon Inlet channel relocation is from Coast Guard notices as reported at the time and from Dare County. The two quoted lines about buoy positions come from a September 2022 thread on The Hull Truth, linked above — a forum, quoted as opinion from people who run the inlet, not as a source of fact.
Survey data: from the US Army Corps of Engineers Wilmington District survey index and from Aqua Map’s own documentation, which gives two different survey counts on two of its own pages. The paper-chart cancellation and the weekday ENC update schedule are from NOAA. The C-MAP navigation disclaimers are quoted from C-MAP’s own notices and app terms.
What we sell: nothing on this page. No affiliate links, no paid placement, no relationship with any of the three companies. Last checked: September 2026.